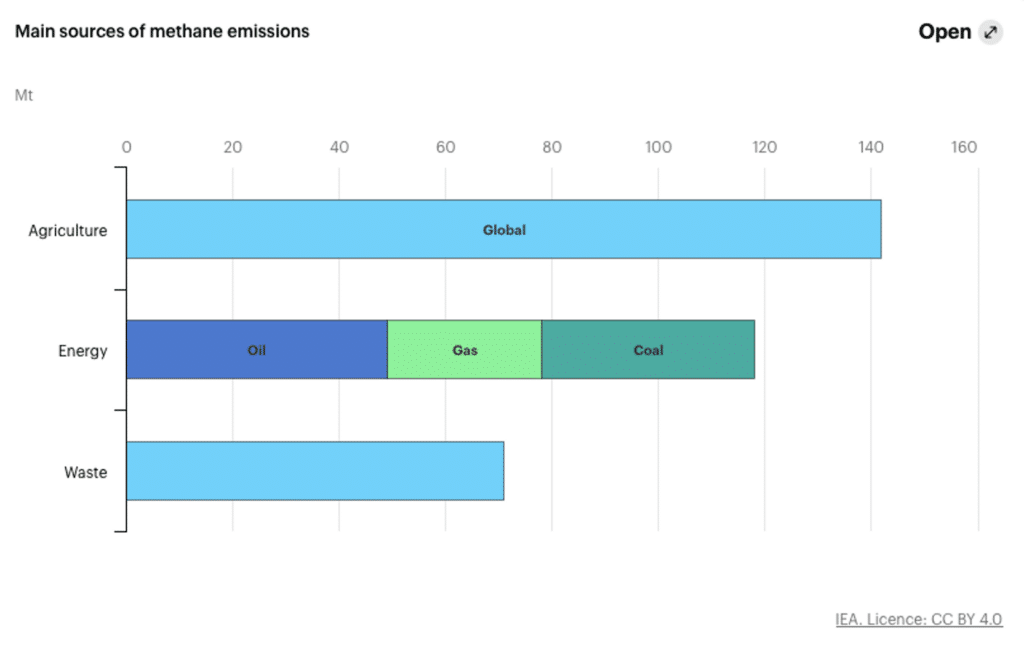
At the end of 2022, the press revealed that Central Asia, the Middle East, and the United States are home to around fifty industrial sites releasing large quantities of methane – a greenhouse gas – into the atmosphere. The public then discovered the methane “super-emitters”, industrialists in the fossil energy, waste treatment and agricultural sectors. Anthropogenic methane emissions are mainly due to livestock farming, rice cultivation, the decomposition of waste in landfills and the exploitation of fossil fuels. The revelations are particularly striking for the fossil industry: these super-emissions are the result of leaks from installations (wells or pipelines) or incomplete flaring – or even a lack of flaring – in oil, coal or gas installations, a practice which nevertheless prevents the release of methane into the atmosphere.
The discovery was made thanks to data from the EMIT satellite mission of NASA. “Before the satellite data, we suspected that significant methane leaks were occurring, but we didn’t know where, when or how much,” explains Marielle Saunois. “Satellites allow methane leaks to be measured independently of industry estimates.” Measurements can be taken on board aeroplanes, weather balloons and even drones. “These in-situ measurements are very localised and sporadic,” says Marielle Saunois. “However, it is important to be able to monitor changes in methane concentrations, for example to check whether the leak has been repaired.”
The first satellite observations of methane were made in the early 2000s. On board the Envisat satellite, the European instrument SCIAMACHY was a spectrometer dedicated to measuring the chemistry of the atmosphere – an observation instrument that determines chemical composition by decomposing the light spectrum. In 2005, the first results from SCIAMACHY made it possible to characterise natural and anthropogenic sources of methane2. At the time, the instrument was unable to identify super-emitters due to its low spatial resolution.
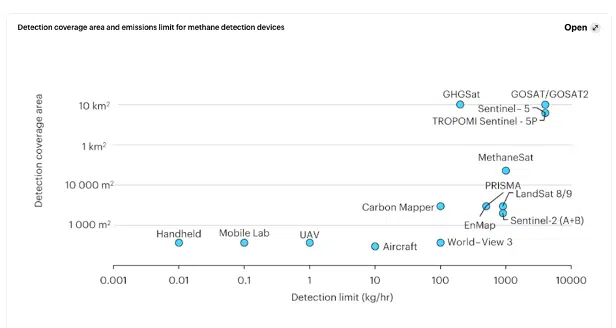
Subsequent generations of satellites have revolutionised our knowledge of the planet. The Japanese GOSAT and European IASI missions, and especially the European TROPOMI instrument on board the European Sentinel-5P satellite since 2017, provide data at finer resolutions. Every day, TROPOMI provides measurements of methane concentration across the globe at a resolution of 5.5 x 7 km2. In addition to this technological advance, there are developments in data processing, such as the use of neural networks and artificial intelligence3.
Satellites reveal massive methane emissions, exceeding industrial estimates
In 2022, in the journal Science, an international team revealed extensive methane emissions using data from TROPOMI4. More than 1,800 anomalies associated with super-emitter sites (releasing more than 25 tonnes of methane per hour) were detected on the planet over the period 2019–2020. Two-thirds of the events are linked to oil and gas production, and occur mainly in Russia, Turkmenistan, the United States, the Middle East and Algeria.
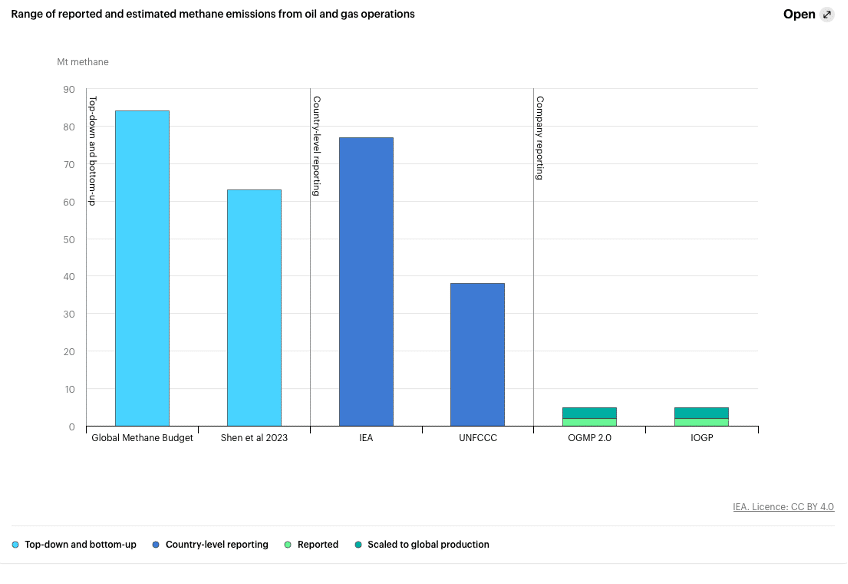
Another revelation of the satellite images was that the official data greatly underestimate methane emissions. In 2018, based on ground measurements, a team already pointed out that its estimate of emissions from the oil and gas sector in the United States was 60% higher than that of the Environmental Protection Agency inventory5. In 2023, another team (Shen et al., 2023, in the figure below) used satellite data to quantify national methane emissions from hydrocarbon exploitation6. The result: total emissions are 30% higher than those officially reported by states under the United Nations Framework Convention on Climate Change, mainly due to under-reporting by the four highest-emitting countries (United States, Russia, Venezuela and Turkmenistan). Methane emissions amount to 62 million tonnes per year for the oil and gas sector, and 32 million tonnes per year for the coal sector. For the climate, this represents the equivalent of 20 years of CO2 emissions from natural gas combustion, according to the authors.
Other estimates have been made by various institutions: the Global Methane Budget scientific consortium and the International Energy Agency (IEA). All are higher than the data submitted by the States and are much higher than those provided by the industries themselves. “Methane is the second most prevalent greenhouse gas emitted by human activity: it is crucial to have a good understanding of its emissions in order to reduce them and mitigate climate change,” points out Marielle Saunois. In October 2024, average methane concentrations in the atmosphere reached 1,943 parts per million, 2.6 times higher than before the industrial era7. Anthropogenic emissions (those linked to human activity) account for around two-thirds of methane releases, with natural sources mainly being wetlands and inland freshwaters8. While the IEA believes that reducing emissions from fossil fuel industries is “one of the most pragmatic and cost-effective options for reducing greenhouse gas emissions,” satellites are valuable allies in identifying the most effective levers.
Is an increase in the number of satellite missions dedicated to methane monitoring on the horizon?
“In recent years, the number of satellite missions dedicated to methane has been increasing, both for scientific reasons and to expand the range of services available to industry,” analyses Marielle Saunois. Many private companies are launching their own satellites to help industry identify methane leaks on their sites. The detection thresholds for methane plumes – i.e. the lowest concentration at which the satellite can detect them – are being lowered all the time: this could be useful for waste industries, whose emissions are less concentrated. Another initiative: at COP27, an international alert system, called MARS, was launched by the United Nations Environment Programme. By compiling all public satellite data, it detects major leaks and alerts the countries and industries concerned. During the first 9 months of its operation, the system detected 500 events.
So, are satellites the Holy Grail for tracking our methane emissions? In an editorial published in Nature11, astrophysicist Lorna Finman denounces an exaggerated enthusiasm: “Their effectiveness is often hampered by limited spatial resolution, atmospheric interference and the challenge of precisely identifying specific emission sources.” She calls for the development of ground-based and aerial observations to improve the accuracy of methane monitoring. Marielle Saunois replies: “It is of course necessary to step up our efforts to improve our estimates of methane emissions sector by sector. Satellite data cannot detect everything: there is a revisit delay, measurements are obstructed by clouds, releases into the sea are more difficult to detect and satellite measurements face certain biases. But methane leaks from the fossil fuel industry or mega-landfills could be easily avoided – unlike those from agriculture. It is crucial to encourage industrialists to improve their infrastructures, and satellites help to identify the sites responsible for these major leaks and to monitor them.”