Intensive care: an app that saved lives
A major issue during the pandemic has been availability of critical care beds in intensive care units. At vital points during the peak in numbers of Covid-19 patients, many hospitals were under pressure. The services needed to know where to send patients in order to prevent over-loading ICUs.
Initially, healthcare staff were noting the number of beds available in different hospitals on Excel sheets, which they were sending to one another via WhatsApp chats. Even though the crisis conditions required fast action, it was neither the most efficient nor the most secure way to share data. Especially since we are talking about information that could have caused panic had it been intercepted.
I work with doctors and nurses in those services on a daily basis and, once we had discussed the problem, I knew we could automate it. As a response, our team designed an easy-to-use digital tool to keep track of beds. At the beginning of the lockdown, we worked around the clock to turn out the tool in 3–4 days. The ICU Bed Availability Monitor (ICUBAM) was immediately picked up by the local health authorities of the Grand Est – a region of France with a population of over 5.5 million people.
The ICUBAM sends a text message to the mobile phones of ICU workers twice a day, with a link to a simple online form. In a matter of seconds, the user can input the necessary information including the number of available beds, whether they were equipped for COVID+ patients or not, and the number of people discharged.
Data was then collected and centralised, which we used to generate models and real-time analyses of evolutions in the pandemic. Throughout the crisis, we continued to interact with doctors, presenting them with the dashboards of our models and figures. The data was there to help them make decisions but of course judgements calls remained their own responsibility.
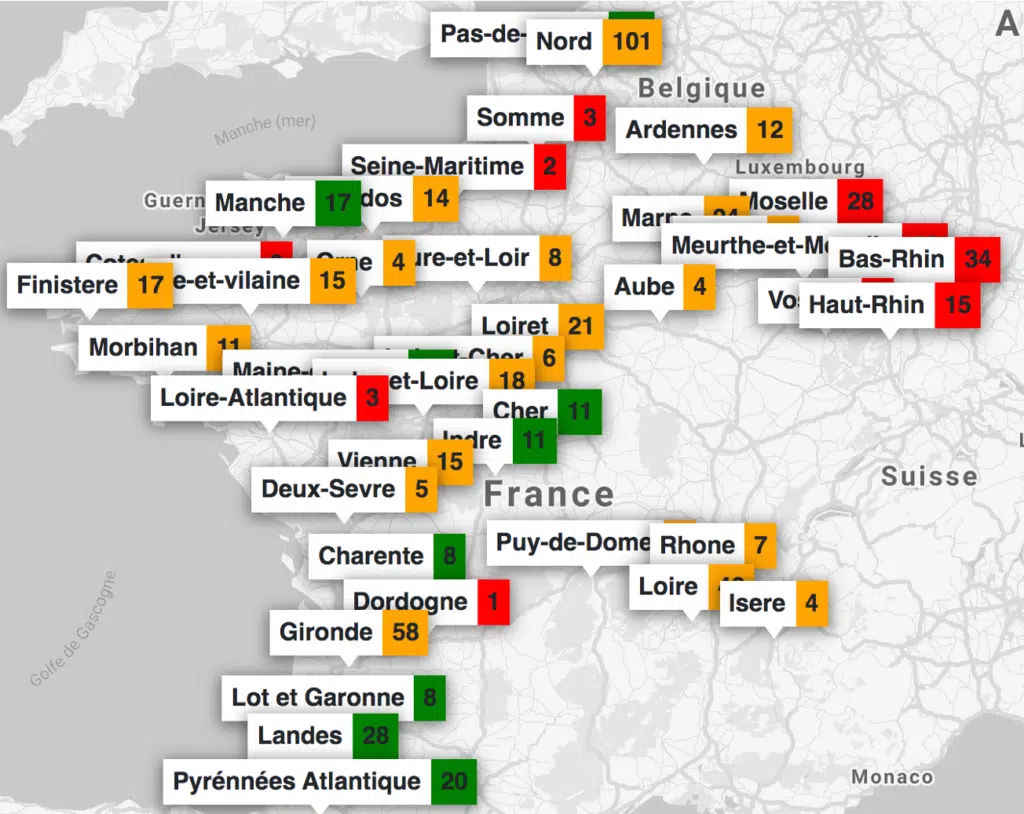
ICUBAM was relatively easy to put in place. All we really needed was a place to store the data – and some funding to cover the cost of the text messages. As the numbers came in over time, we transformed the data into a visual map of the pandemic across the country. From that, we were able to go further by combining the data from different hospitals with epidemiological models of the pandemic to predict availability of beds in the coming days. Our goal was to provide vital information to doctors who were making difficult decisions about where to send high-risk patients.

After the lockdown period at the beginning of summer 2020 we stopped running the ICUBAM. However, we were later contacted by many intensive care health workers with requests for us to put it back into action in preparation for the second wave. On our side, we would like the authorities on a national level to take up the system; health workers in ICUs need it. To face the second wave, the ICUBAM has been put back into action by INRIA and four French regions. For me, this shows our capacity to redeploy the tool when needed.
Digital tools like ICUBAM can provide real insights into public health issues by keeping track of important data for doctors, but also so that we may analyse it to better understand a situation for other stakeholders. We created it in a matter of days, and the format could easily be adapted to other crisis scenarios. Depending on the context, it could be used to track availability of medical materials, their storage locations and so on. In developing countries, similar data collecting systems could help support and track public health crises.
On a positive note, post-lockdown I have also noticed more PhD applications in my field. It would seem that the pandemic offers an example of how statistics can be applied to real-life situations. Young scientists want to apply their knowledge and there are many other exciting challenges to tackle in the domain of artificial intelligence for health.


