Renewables: yields vary according to climate


- According to the WMO and IRENA, global warming is having an impact on the production of renewable energies, particularly wind, solar and hydroelectric power.
- Some regions, such as southern Africa and South-East Asia, could experience seasonal difficulties in supplying their electricity grids.
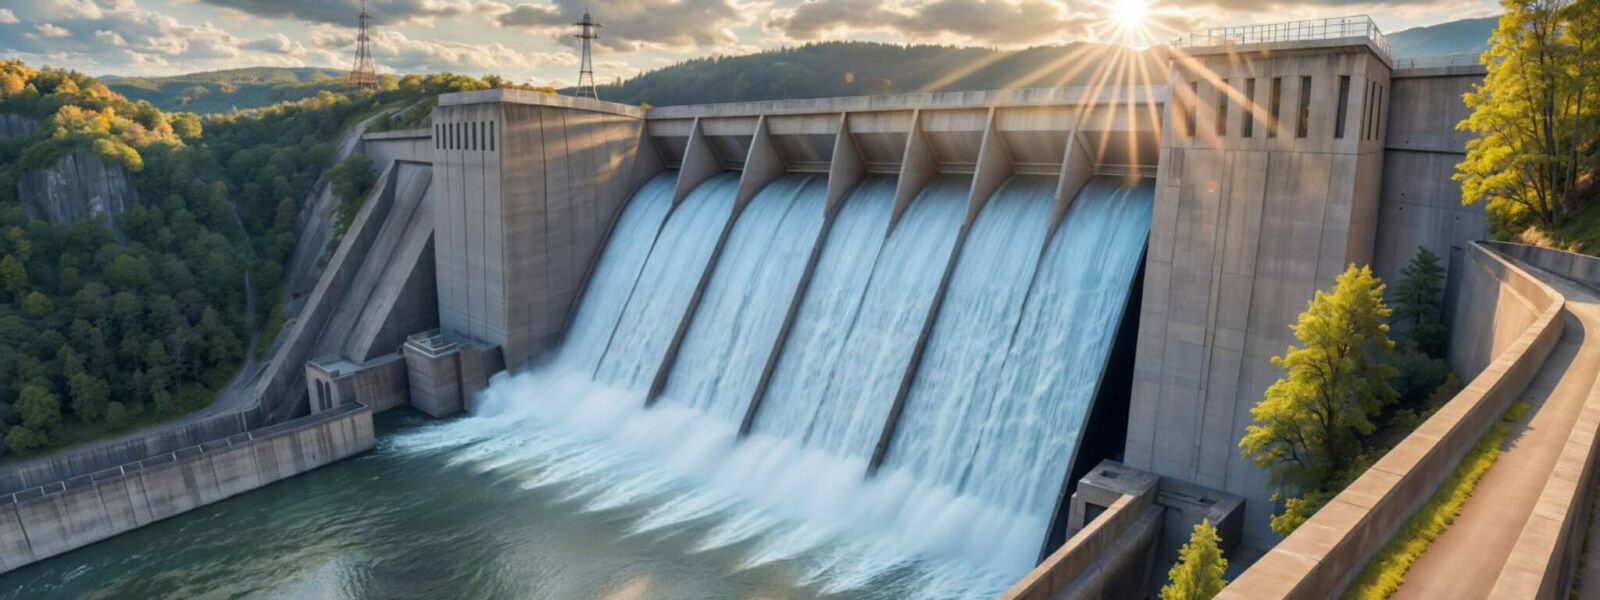
- Hydroelectric production is directly linked to rainfall patterns and could decrease in regions subject to drought, while increasing at high latitudes.
- Fluctuations in wind generation could particularly affect densely populated regions, with declines of up to 10 or 30%.
- The key: using a mix of renewable energies to compensate for variations and continue to decarbonise our production.
At the end of 2023, the World Meteorological Organisation (WMO) and the International Renewable Energy Agency (IRENA) warned1: “A better understanding of climate factors and their interactions with renewable resources is vital to ensure the resilience and efficiency of energy systems and associated transitions.” The massive transition to renewable energies is essential to contain man-made global warming: their total installed capacity must rise from 3,870 GW in 2023 to 11,000 GW in 2030 to limit warming to 1.5°C2.
But the two agencies emphasise the impact of global warming itself on energy production. Of the four indicators considered, all are impacted. This applies to wind power, solar power, hydroelectricity and energy demand. “It is essential that political decision-makers anticipate the future of energy infrastructures and assets, taking into account the effects of climate change and the resulting increase in demand,” explained Francesco La Camera, Director General of IRENA, in a press release. In its latest synthesis report3, the Intergovernmental Panel on Climate Change (IPCC) states that the impact of climate change on electricity production should not compromise mitigation strategies on a global scale. On the other hand, it points out that the regional impact can be significant, particularly for wind and hydroelectric power. Regions such as southern Africa and South-East Asia could find it difficult to power their grids in certain seasons. Conversely, South America could consider reselling surplus energy.
The global impact of cloud cover
Let’s start with solar energy, which has the greatest production and expansion potential. Electricity production is directly linked to the amount of sunshine – which varies according to latitude – and the presence of clouds. “Cloud cover depends on temperature, humidity and pressure fields in the atmosphere, which are themselves influenced by climate change,” explains Sylvain Cros. In 2022, the load factor4 – i.e. the yield – has changed very little compared with the period 1991–2020. IRENA has observed the biggest changes (+3 to +6%) in Bolivia, Paraguay and Argentina, countries already ranked among those receiving the most solar irradiation. By 2050, a study published in Nature Sustainability5 identifies a doubling in the number of low-efficiency days in summer in the Arabian Peninsula, and conversely a halving of these days in southern Europe. For an intermediate scenario of greenhouse gas emissions (RCP4.5, for which warming reaches 2.7°C by the end of the century), the changes in solar production in summer in 2050 are moderate: ‑4% for the Arabian Peninsula, +5% for Central Europe, +3% for the Atacama Desert, ‑2% in south-east Australia and north-west Africa and +2% in China and south-east Asia.
On a global scale, the variations in production linked to climate change are therefore very small. According to the IPCC, these variations are unlikely to compromise solar energy’s ability to support the energy transition. “Projections show that the rise in temperature increases cloud cover, mainly in arid regions,” explains Sylvain Cros. This is due to an increased evaporation of water from soils and oceans, combined with an increase in convection, which favours a rise in altitude and condensation into clouds. “But there are other factors that contribute to cloud cover, and these models are far more uncertain,” adds the scientist. As for socio-economic factors, these are difficult to predict. Technological advances are increasing the yield of photovoltaic panels. Sylvain Cros adds: “The rate of deployment is another important factor: solar panels have become so cheap that the speed of their deployment could offset the effects of the drop in irradiation.”
Regional variations and wind generation
Another important mode of renewable energy production is wind power. By comparing the load factor for the year 2022 with the period 1991–2020, the WMO-IRENA note significant changes. Many European countries are recording a decrease of 10% or more, and the drop exceeds 16% in Central America and Papua New Guinea. Conversely, increases of 8% are seen in sub-Saharan Africa, Madagascar, Bolivia, Paraguay, Korea, and the United States. But studies seem to show that natural climate variability (the alternating El Niño-La Niña phenomena, for example) largely explains these variations, rather than warming linked to human activities.
“Changes in surface temperature are well understood in climate projections. On the other hand, changes in atmospheric circulation are much more difficult to model, as there are many mechanisms that can influence wind production6,” says Riwal Plougonven. As a result, it is difficult to identify a clear large-scale signal for the future. The IPCC estimates that long-term wind energy resources will not change significantly in future climate scenarios. However, certain regions could be affected by significant variations, either from one year to the next, or from month to month. In a summary of 75 studies7, the authors note a reduction in production potential in the western United States for the second half of the 21st century, and a downward trend for most of the northern hemisphere (Europe, Russia, China).
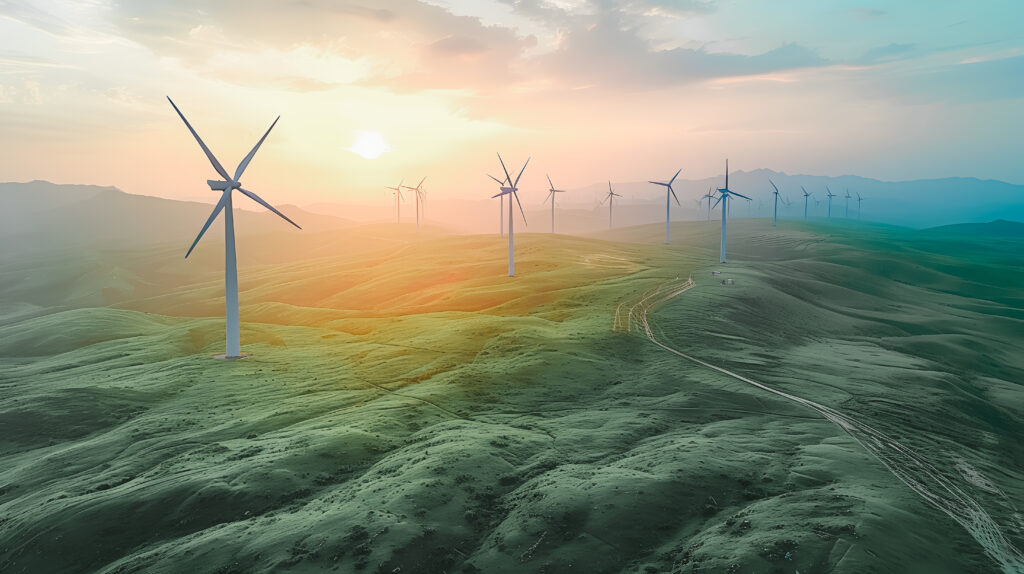
Conversely, wind power production in Central and South America, southern Africa and South-East Asia is showing an upward trend. In a study published in February 20248, other authors note significant decreases between now and 2100 for the worst-case scenario of GHG emissions – around ‑10%, for example, for most of the European Union and the United States. They point out that this decline particularly affects densely populated regions, increasing the impact. “The magnitude of these changes can be significant, in the region of 10–30% depending on the region,” notes Riwal Plougonven. But he qualifies that: “Most studies focus on the worst-case scenario for GHG emissions (SSP5‑8.5) and projections for the end of the century. However, this scenario is unlikely, and the horizon – even if it is interesting – is too far away compared with the time scales of the wind energy sector.”
With regard to hydropower, the indicator evaluated in the WMO-IRENA report shows a reduction in 2022 in South America, East Asia, Central and East Africa and Western Europe. On the other hand, there will be an increase in Canada, Mexico, Russia, India, Nepal, South Africa, Australia and the Scandinavian countries. As with solar energy, these observations are mainly linked to the La Niña climate regime in place in 2022. Hydroelectricity production is directly linked to water availability and is modulated by temperature and rainfall intensity. As for the future, a large proportion of hydroelectric power stations (61% to 74%) are located in regions where significant declines in river flow are projected as early as 2050. Overall, it is estimated that high latitudes will see an increase of 5–20%, while regions subject to drought will see a decrease of 5–20% (this concerns North and Central America, southern Europe, the Middle East, Central Asia, and southern South America).
Important projections for finding solutions
It is important to consider these projections when planning the deployment of renewable energies. Some regions of the world could find themselves in a win-win situation, “benefiting” from the increased production of several energy sources. Conversely, other regions could be doubly or triply affected. The WMO-IRENA report takes the case of the region comprising Botswana, Mozambique, Namibia, South Africa, and Zimbabwe: in June 2022, solar production was reduced, but the region recorded significant increases in hydroelectricity and wind power production. By contrast, by October 2022, most indicators were falling, putting electricity supplies at risk. “The use of a mix of renewable energies is key to ensuring that variations can offset each other,” points out Riwal Plougonven. Finally, electricity exchanges between regions could mitigate these effects: for example, the greater potential for wind power in North America could offset the reduction in Mexico. The WMO-IRENA emphasise the role of early warning systems in securing energy throughout the world.
Riwal Plougonven concludes: “It is clear that these variations linked to climate change must be taken into account to optimise our production of renewable energies, but this does not call into question the massive and necessary deployment of these energies to decarbonise our energy.” The last major effect of climate change on the energy transition? Energy demand.